Geographical Map
The Astrocartography features described below are not available in the Lite or Pro versions of ZET.
A geographical map of the Earth is always accessible in ZET as a multi-purpose tableau. It is used for astrocartography and cyclocartography, to display eclipse paths, and to obtain location coordinates for a birth or other event whose location is not available from the Atlas gazetteer.
The Geographical Map tableau is displayed by:
- clicking the
 "Geographical Map" Toolbar button, or
- selecting "Tableau" | "Map" from the main menu, or
- clicking the "Find on Geographical Map" button
in the Atlas (gazetteer) window.
Apart from the basic depiction of land and sea, the map can display:
- cities, with size marking conformant to city size and the map scaling,
- city names, with the font size of legends intelligently related to city size and the map scale factor,
- the current geographical location(s), i.e. of the Event Data,
- a variety of astrocartographic information,
- country and region borders,
- night regions, etc.
If you have ZET Geo a scaled topographical (relief) map of the world is available to you. Here is a fragment of this map at a scale of 1 pixel/kilometer:
Tooltip information is available for map features. The ZET main window title bar displays details of the current event data. The Status bar at the bottom of the window shows the longitude and latitude at the mouse pointer, and the map scale factor current in use.
To pick coordinates for birth or event data, zoom in on the region of interest (see the section below), position the mouse pointer, and click the right mouse button. From the popup menu select "Utilize Coordinates". Note: if you pick coordinates from an empty region (i.e. not from a city location), this operation does not change the time zone in effect.
To animate the tableau use the  Dynamics of Time and
  Dynamics of Location control panels.
These are useful primarily for astrocartographical research.
Dynamics of Location control panels.
These are useful primarily for astrocartographical research.
Map Tools
The following tools are available at the right of the Toolbar:
- "Drag" tool - click the Toolbar
 icon to select, then
click and drag with the mouse in the tableau while holding down the
mouse button,
icon to select, then
click and drag with the mouse in the tableau while holding down the
mouse button,
- "Marquee Zoom" tool - click the Toolbar
 icon to
select, then click in the tableau and drag the mouse while
holding down the mouse button to open an elastic rectangular frame on the
tableau. When you release the mouse button the map is zoomed to
the framed area. (You can set the color of the marquee rectangle on the
Color tab of the Geographical Map Settings window),
icon to
select, then click in the tableau and drag the mouse while
holding down the mouse button to open an elastic rectangular frame on the
tableau. When you release the mouse button the map is zoomed to
the framed area. (You can set the color of the marquee rectangle on the
Color tab of the Geographical Map Settings window),
- "Measure" tool - click the Toolbar
 icon to select,
then click in the tableau to set an origin and drag with the mouse.
An elastic line is drawn between the origin and the
mouse pointer, and the distance between them is displayed on
the Status bar (the distance on a spherical Earth and, in brackets, its longitudinal
and latitudinal components).
It is also possible to measure distances as off a paper map (in millimeters): see
Map Settings, Misc. tab.
icon to select,
then click in the tableau to set an origin and drag with the mouse.
An elastic line is drawn between the origin and the
mouse pointer, and the distance between them is displayed on
the Status bar (the distance on a spherical Earth and, in brackets, its longitudinal
and latitudinal components).
It is also possible to measure distances as off a paper map (in millimeters): see
Map Settings, Misc. tab.
- "Zoom In (PgUp)", "Zoom Out (PgDn)" buttons and zoom indicator - click the upper (bullet) button to zoom in, and the lower (point) button to zoom out. Zooming the map does not deselect the current map tool. Zooming can also be performed using the arrow cursor keys on the keyboard. (You can set the properties of the zoom buttons on the Grid tab of the Geographical Map Settings window),
The 'current location' markers indicated by the red spot (core data) or the blue spot (background data) can be repositioned (with Drag, Marquee Zoom, and Measure tools unselected): click on a marker with the mouse and drag it to its new position while holding down the mouse button.
The map is capable of 12 zoom levels. These are designated from Scale 32 - 1"/pix (highest magnification = one arc-second per screen pixel) thru Scale 1/64 - 32'/pix (lowest magnification = 32 arc-minutes per screen pixel). The magnification doubles (or halves) at each zoom step. The current map scale factor appears on the Status bar.
Here is an example of a zoomed (Scale 8 - 4"/pix) map fragment:
The display of city names is adjusted automatically at each zoom level. The quantity and the style of map legends displayed is adjustable on the Misc. tab of the Geographical Map Settings window.
Introduction to Astrocartography
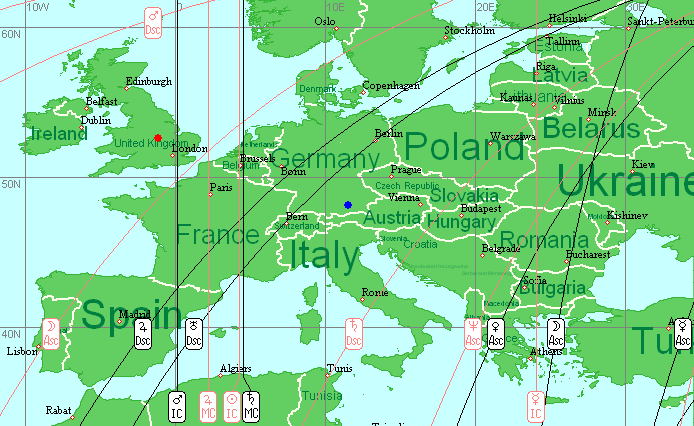
One method of astrocartography calculates points on the Earth at which the planets of the horoscope chart appear conjoined with the chart's angles (i.e. Asc, MC, Desc, IC). Let's consider what this means.
Taking first the prime vertical, the locations on the Earth at which 'Sun on MC', 'Mercury on IC', etc will be true (i.e. where these planets appear conjoined with the meridian) will comprise vertical lines on a standard (Mercator) map projection of the Earth's surface - since they connect places of equal longitude. Less evidently, if we draw lines connecting the places in which planets are in major aspect to the Asc-Desc axis, then we will arrive at sinusoids. By mathematical interpolation we can derive loci for the intermediate cusps and houses.
From the astrological point of view, we are especially interested in
geographical points - and by extension, the latitude - at which
two natal planets are simultaneously
conjoined with the angles of the horoscope chart. The map depicts
these as the intersection of two projection lines. These points of intersection are the
so-called parans,
and their astrological interpretation is broadly as follows: if you
want success, relocate to a place where Jupiter is at MC. If you
want to get married, move to where your natal Venus is on the
Descendant, and so on. (See the above graphic for an example of
these astrolocality lines).
There are two variations on this technique of
astrocartographical projection. The first is concerned with lines covering places
at which a planet of interest is precisely
on the Ascendant, i.e. where, as seen from the Earth, the planet
has the ecliptical longitude of the Ascendant (and similarly, lines involving
aspects of the planets and the
Descendant, MC and IC). In the second, places on
the globe are considered of interest at which the planet
crosses the horizon (and similarly, the
celestial meridian and prime vertical).
While broadly similar, these variant techniques produce somewhat different results when a planet 'has latitude', i.e. its orbit has taken it away from the plane of the ecliptic. ZET caters for both these variants of astrocartography.
Astrocartographic displays- Lines marking places on the Earth where the Sun, Moon and planets are at the zenith,
- Images of the astrological houses - lines of projection of the great circles of houses onto the surface of the Earth (for more about the circles of houses, see the Sky topic),
- Lines marking places on the Earth where planets form aspects to angular house cusps, indicating places where, at the given moment, those aspect are operating particularly strongly. Astrological relocation is based on choosing places which, in relation to the planets in the horoscope, favourably satisfy a given criterion. While times of birth are fixed and unalterable, locations can be chosen in relation to a birth chart that are advantageous to some goal,
- Symbolic projections of cities onto the ecliptic - the geographical coordinates of cities are treated as equatorial coordinates (Right Ascension and declination), and then transformed into ecliptical coordinates. The resulting symbolic projection of the city can be considered as another heavenly object in a natal (or transit, etc) chart, which can participate in aspects and other astrological syntheses,
- Projections of celestial bodies onto the geographical map (stars, planets, asteroids) - points can be derived indicating places in which planets, asteroids and stars are on the zenith at the time of interest (real horizontal projection),
- Symbolic projection of stars - stars can be considered as having a symbolic equatorial projection, in which their celestial equatorial coordinates are made conformant with geographical coordinates, and the resulting point considered as a projection of the object onto the Earth. This allows the astrological influence of stellar objects on terrestrial regions to be analysed. (This is the inverse of the symbolic projection of a city onto the ecliptic),
- Symbolic projection of planets - lines of projection of celestial objects for points considered to have the same zodiacal longitude as a given object (but different zodiacal latitude), a symbolic equatorial projection of these points onto the Earth then being derived. These lines are interpreted as zones of influence of the object(s) in the region. You can choose any set of planets and one star for this,
- Local Space - lines of geographical azimuth bearings derived from the positions of the planets,
- The facility to creates astrocartograms not only for planets, but also for any asteroid, virtual object, or pars,
- Selection of any subset of the 10 planets and other objects of interest,
- Selection of any pair of angular houses, or all of them,
- The option to displaying either conjunctions only, or all the major aspects.
Local Space Astrology
In the Local Space Astrology method of astrocartography, the celestial coordinates of planets are translated into a system of horizontal coordinates (i.e. bearings) at a given location.
While Local Space projections can be depicted on the Geographical Map, the Local Space chart can also be displayed on the Chart tableau. It contains a compass rose to remind you that bearings are being represented:
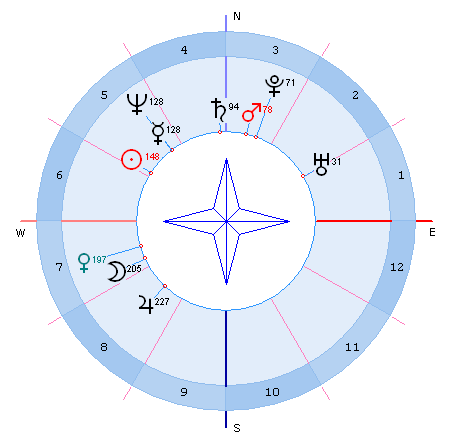
To erect a Local Space chart, the following settings are required:
- Chart Settings - Format, East of Wheel, Degree: 180
- Chart Settings - Zodiac, Coordinate System: Horizontal
- Chart Settings - Wheel, "Compass": selected.
The popup menu
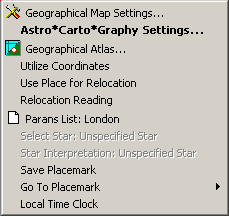
Click the right mouse button in the tableau for a popup menu of options:
- Geographical Map Settings... - opens the Geographical Map Settings window,
- Astro*Carto*Graphy Settings... - opens the A*C*G Settings window,
- Geographical Atlas... - opens the Atlas window of city names and coordinates, e.g. to pinpoint a particular city on the map,
- Utilize Coordinates - transfers the coordinates of the location under the mouse pointer to the Event Data (or Your Location) window. The local event (birth) time is not changed. NOTE: if a city is selected when you invoke the popup menu, the time zone and name of the time zone table in the Event Data window is also transferred; otherwise the time zone is not changed and time zone table name field is cleared,
- Use Place for Relocation - utilizes the Relocation technique, changes the birth location data; the Universal (GMT) birth time is not changed.
- Relocation Reading - displays a window with the interpretation text (if available) for Relocation to the selected point,
- Parans List: [city] - displays the list of parans for the latitude of the city indicated (pointed to by the mouse) according to an orb. The list includes the parans of stars,
- Select Star: [star] - this and the next menu item are enabled if the mouse pointer is positioned on the projection of a star on the map. This option retrieves the name and designation of the star into the A*C*G Settings dialog.
- Star Interpretation: [star] - displays an astrological reading (interpretation) of the specified star (if available),
- Save Placemark - saves the current map state (position and scale) as a Placemark,
- Goto Placemark - restores a Placemark from the submenu list, i.e. resets the map to a previously saved state,
- Local Time Clock - creates a floating panel with the local time for the city pointed
to by the mouse. The local time is updated in real-time. You may create several clocks, and
they are saved on exit from ZET and will be restored when ZET is restarted.
You move a clock by dragging it with the mouse, and close it by right-clicking.