Geographical Map Settings
The Geographical Map Settings window is opened by:
- clicking the
 "Settings" Toolbar button
and selecting the "Geographical Map Settings..." menu item, or
"Settings" Toolbar button
and selecting the "Geographical Map Settings..." menu item, or
- selecting "Settings" | "Geographical Map Settings..." from the main menu, or
- right-clicking in the Geographical Map tableau and selecting "Geographical Map Settings..." from the popup menu.
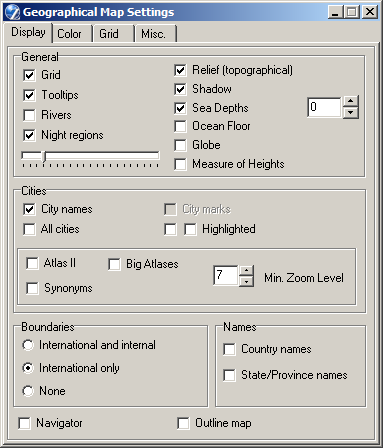
The Display tab
General panel:
- Grid - overlays the map with a coordinates grid,
- Tooltips - enables place-name tooltips for the mouse pointer,
- Rivers - displays river features,
- Night regions - when checked, regions of the Earth currently in the Sun's shadow are rendered in a darker tint. The slider control below the checkbox allows you to adjust the tonal value of the night region,
- Relief (topographical) - activates the topographical map. (This
option is available in ZET Geo version only),
- Shadows - emphasizes the relief of map terrain,
- Measure of Heights - enables the display on the Status bar of the spot height (in meters) of the location at the mouse pointer. NOTE: When you operate in full-screen mode or exit a program, this option is checked off.
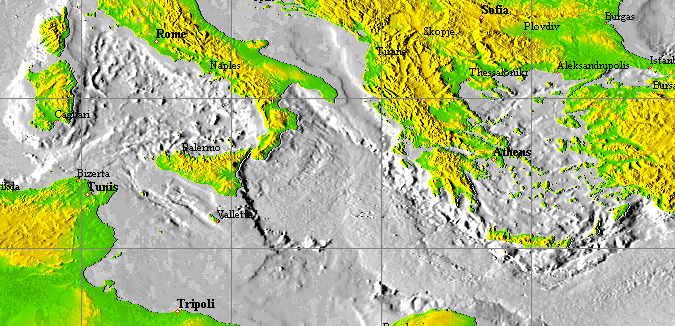
- Sea Depths - the color of sea water depends of depth in this point:
- Ocean Floor - display the ocen floor without water:
Cities panel allows you to adjust the display of map legends for cities:
- City names - activates the display of city names on the map,
- All Names - displays all available city names (deselected by default),
- City marks - when checked, every location in the Atlas is marked on the map,
- Highlighted - the checkboxes allow alternative means of highlighting city name legends on the map,
- Atlas II - displays city names from Atlas II also, if this atlas is available,
- Big Atlases - displays cities and other features from Big Atlases on the map, if the Big Atlas exists for displaied country,
- All synonyms - it is not uncommon for a city to have alternative names. Normally these synonyms not displayed on the map. Check this option if you want to include all alternative names,
- Min. Zoom Level -
sets the limits of the zoom level when an Atlas II and a Big Atlas's city names are displayed -
preferable to a dramatic reduction in performance!
It is not recommended to set a value of less then 10.
- International and internal,
- International only,
- None.
Navigator check-box displays a mini-World map which previews the current frame location. Clicking in the Navigator recenters the tableau to that location.
Outline map - displays an outline version of the map for printing.
Upgrade Topographical Map button - opens the upgrade control panel, see below.
The Color tab
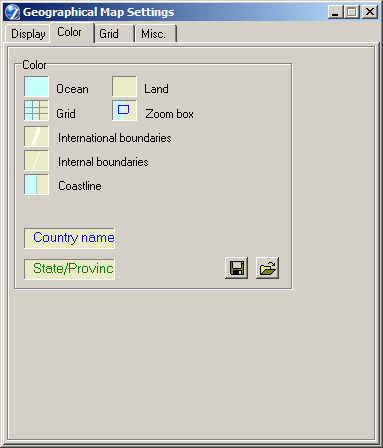
The options on this tab allow you to change the colors used to render the Geographical Map. You can set colors for oceans, landmasses, coastlines, boundaries, the coordinates grid, and the zoom marquee. To edit a color, click with the mouse on the icon adjacent each option to open a standard Color picker dialog.
Color schemes can be saved and retrieved using the Save and Open file buttons. Schemes are stored in the [ZET] folder as <file-name>.gpl.
The Grid tab
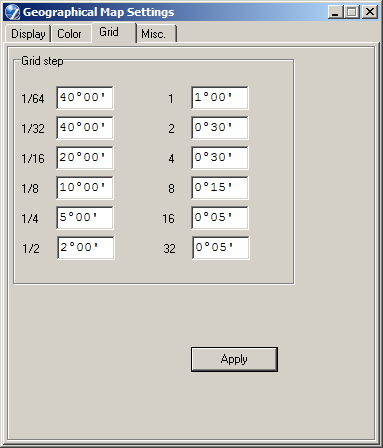
This tab allows you to set the grid line spacing for the Geographical Map tableau at each of 12 magnification steps. The zoom steps are labelled from "32" (highest magnification) thru "1/64" (least magnification). The grid is not visible unless it has been enabled on the Display tab.
The grid step means the distance between grid lines. This distance should be specified in degrees and arc-minutes. Click in an entryfield to edit the current setting. You can obtain the degree symbol by typing Alt+0176 (NumLock off), or by cut-and-paste from an adjacent entryfield. To obtain the arc-minute symbol, type the single-quote character '. Click the Apply button to effect your changes.
The Misc. tab
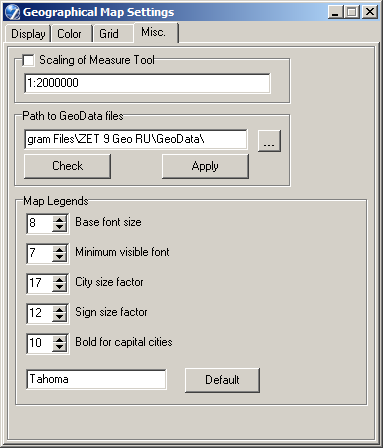
Scaling of Measure Tool panel sets the properties of the Measure tool, which is located on the right side of the Toolbar in the Geographical Map tableau. Uncheck the Scaling option to display measured distances in kilometers (km) on the status line of the tableau. Check ON to display measured distances in millimeters (mm) for a paper map with the scaling set in the entryfield.
Path to GeoData files panel allows you to select the drive and folder specification for geographical data files. By default this is [ZET]\GeoData. The following files and subfolders may be present, depending on your version of ZET:
- GTOPO30 - folder with topographical map files,
- Lake - folder with lakes data files,
- AdminBound.dat - internal boundaries data file,
- Boundary.dat - international boundaries data file,
- Rivers.dat - rivers data file,
- Shoreline.dat - high resolution map file.
This function is helpful if you use several versions of ZET in different folders and allows you to utilize a single common set of the huge geo-files.
To set a path click the ... "Browse" button (right of field). The following dialog is displayed:
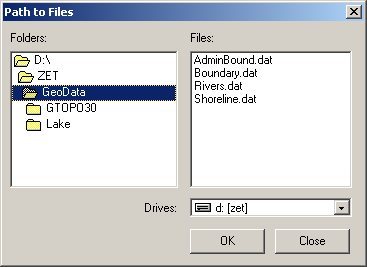
Locate the "GeoData" folder which contains the files, and click "OK".
Map Legends panel controls the display of city names on the map. Click the spin-buttons to change the settings, or click in the entryfield and type a new value.
- Base font size - sets a baseline font scale factor (default 8),
- Minimum visible font size - reduce to display more cities; increase to display fewer cities (default 7),
- City size factor - controls how the displayed real size (city circles and legends) of cities is displayed in relation to the code indicating size in the Atlas (default 17).
- Legends size factor - controls how the legends font size is displayed in relation to the city size and the zoom level (default 12).
- Bold for capital
cities - specifies a zoom level above which capital city names are rendered
in a bold font (default 10).
Clicking in the Font entryfield at the base of the panel opens a Fonts dialog allowing you to select a font for the map legends.