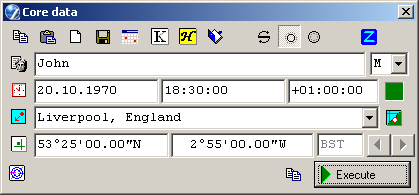
Event Data
The Event Data window is where you input time and location details for creating astrological charts and interlinked tableaux.
To open the Event Data window:
- click the
 "Event Data" Toolbar button,
- select "Horoscope" | "Event Data..." from the main menu,
- right-click in an empty region of the Chart tableau and select "Event Data..." from the popup menu,
- type the hot-key 'B'.
The window title is either Core data or Background data, because the same form serves to input details for some types of horoscope which utilise two data-sets (for more information see Core and Background data). Beginners will mostly use the Core data form.
Inputting event details
Input or select the following data to erect a horoscope:
- Input name of the native, or brief description of the
event (this field is optional), press Tab key.
- Select a gender (sex) from drop-down list, e.g. press any keys: -, M, or F,
press Tab key.
- Input date and (local civil) time of the event. Just press a sequence of
digital keys, the separators will inserted automatically. Do not use Del or BackSpace.
Press Tab key after every field.
NOTE: the default date format is European style (day.month.year). To set it to US style (month/day/year) switch the Date Format setting on the Misc. tab of the General Settings window.
NOTE: to enter the date of an event B.C. (Before Christ), type the letter B after the year.Pre-Gregorian calendar dates are adjusted for automatically, according to the accepted rules of astronomy, i.e. Monday, 24 September 1582 in the Julian calendar is followed by Tuesday, 5 October 1582 (Tuesday) in the Gregorian calendar. The date of adoption of the Gregorian calendar by different countries is a matter for historical research.
- Normally skip next field: difference between local civil and Greenwich (Universal) time as a Time Zone.
This field will fillfulled automatically when you selects a city from Atlas.
But you can fillfull it manually, if you know this value.
NOTE: Time Zones are displayed in European style, not US style: locations East use a + sign, those West use a - sign.
- Select location: (city) name, country, area,
state, etc. To do that enter a city name (or just several first letters of name)
and click the
 Atlas button. Opens a window
containing a world gazetter of place names, together with their
geographical coordinates and time zones. From there any entry can be
selected and its details automatically inserted into the
form.
Or you can select city from the drop-down city names list
(the "operational atlas", this is a history of your selections from Atlas).
Atlas button. Opens a window
containing a world gazetter of place names, together with their
geographical coordinates and time zones. From there any entry can be
selected and its details automatically inserted into the
form.
Or you can select city from the drop-down city names list
(the "operational atlas", this is a history of your selections from Atlas).
- Fillfull a latitude and longitude of the location of the event. Normally these fields
are completed automatically by selecting a city from Atlas.
- Click
 "Additional comments" button to open a
subsidiary text window into which additional comments, such as the
reliability of the supplied natal data, biographic details, photos, etc may be
entered. (In the Database window, these are displayed in a separate pane).
"Additional comments" button to open a
subsidiary text window into which additional comments, such as the
reliability of the supplied natal data, biographic details, photos, etc may be
entered. (In the Database window, these are displayed in a separate pane).
ATTENTION: Watch for Time Zone Table indicator (colored rectangle right of Time Zones field) which informs about TZ calculation mode. The colors of indicator means:
- green - TZ table established and allows for calculation
- yellow - the calculation of TZ table disabled
- red - TZ table does not established
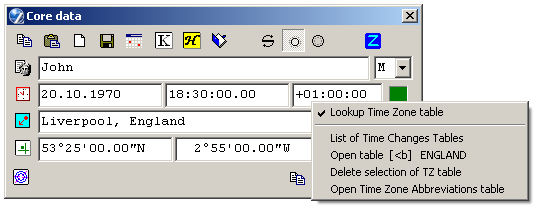
There are following items:
- Lookup Time Zone Table - when unchecked allows the time zone data to be entered manually from the keyboard. Normal operation is with this setting checked, so that time zones are set from the Atlas, with allowed overrides as described next.
- List of Time Changes Tables, switches the window to display the list of world time zones to select manually (nornmally no need to use).
- Open table [code] name, to view a selected Time Zone Table, listing historical civil time changes which occurred in a time zone. Normally the name of TZ table should be present.
- Delete selection of TZ table, (nornmally no need to use) clear selection of TZ table.
- Open Time Zone Abbreviations, opens a window with a comprehensive list of time zones, their names and abbreviations. A time zone can be selected here (if "Lookup Time Zone Table" unchecked) for the event data by double-clicking an item with the mouse. This setting will override the time zone set by Atlas look-up (normally used for selecting LMT or LAT in special cases).
Also to complete the event data you can load it from Data Base.
Click  "Open Database" button to open the
Database window of stored chart details,
from which an item can be selected for automatic loading into the currently displayed
form (core or background data).
"Open Database" button to open the
Database window of stored chart details,
from which an item can be selected for automatic loading into the currently displayed
form (core or background data).
Selecting the type of chart
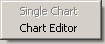
If you wish to get a natal (single) chart, then skip this chapter and proceed to "Erecting the chart" (see below).
A Horary is constructed as a single chart, but for the moment of
'birth' of an idea, question, or event. Selecting the horary chart type
will cause ZET to take account of additional special
settings available for horary charts. After selecting the horary chart type
clicking  button, proceed to the section
Erecting the chart below.
button, proceed to the section
Erecting the chart below.
The L button serves for obtaining the chart of a relocation (the births time,
but any place).
To cast a chart of relocation (local chart):
1) Establish your natal data.
2) Press the button L and choose the relocation city from the atlas
(see the button to the right of the city name field).
That's all, the chart of relocation will appear on the screen.
When saving this chart in the history of calculations the entered data about
local will remain.
To check correctness of a relocation: press and release the button L,
coordinates of house cusps will change thus, but coordinates of planets
shouldn't changes.
To get a Cosmogram click  button.
A chart named Cosmogram (in contrast to Horoscope), if birth (event) time is unknown.
In this case the houses does not indicates on a chart, in a field of birth place
indicates "cosmogram", etc.
button.
A chart named Cosmogram (in contrast to Horoscope), if birth (event) time is unknown.
In this case the houses does not indicates on a chart, in a field of birth place
indicates "cosmogram", etc.
To make the chart type selection, use "Chart Type Selector" tool. To invoke the Chart Type Selector you can:
- click the
 button
in the Event Data window (in this case the Chart Selector appears as "glued" to
the bottom of the Evant Data window), or
button
in the Event Data window (in this case the Chart Selector appears as "glued" to
the bottom of the Evant Data window), or
- click the button
on the Toolbar, or
- select "Control" | "Chart Type Selector..." from the main menu, or
- type the F4 hot-key.
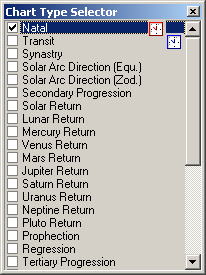
Here it is necessary to set a desired type of double chart by checking an appropriate check-box by mouse or "space bar" key. To get a complex (more then two rings) chart you can check several check-boxes by pressing Shift key with mouse clicking on check-box, or double mouse clicking on the item caption (right of check-box).
The following types are predefined (NOTE: only transit and synastry types of dual charts are available in ZET Lite):
· Synastry - shows the interaction of two natal charts,
· Equatorial Directed (1 degree = 1 year) - describes a symbolic conformity between the daily rotation of the Earth (equator) and the annual rotation of the Earth around of the Sun (ecliptic),
· Zodiacal Directed (1 degree per year) - as above, but in a simplified form,
· Secondary Progressed (1 day = 1 year),
· Solar Arc Directed (Equatorially based),
· Solar Arc Directed (Zodiacally based),
· Solar Return - calculated for the moment of return of the Sun to its natal position (used for annual forecasts),
· Lunar Return - calculated for the moment of return of the Moon to its natal position (used for monthly forecasts),
· Planet Return - calculated for the recurrence at a zodiacal longitude of one of the main planets. To select the planet, first select this chart type, then right-click on the item to display the popup menu of planets,
· Minor Solar Return - calculated for the moment of return of the Sun to its degree of sign in each sign of the Zodiac,
· Terrar - birth time return,
· Embolismic Lunation - calculated for the moment of recurrence of the natal Sun-Moon phase angle (used in medical astrology),
· Embolismic Lunation Progressed - Embolismic Lunation chart progressed at 1 synodic month for each year (synodic month: the period of recurrence of a Moon phase; 1 tropical year consists of 12.368267 synodic moon months),
· Lunar Return Progressed - Lunar Return chart progressed at 1 sidereal month for each year (sidereal month: the period to the recurrence of the Moon at a zodiac longitude; 1 year consists of 13.368228 sidereal moon months),
· Persian Directed (1 degree = 1 year) - houses are motionless,
· Profected (30 degrees = 1 year)
· Regressed (1 day = 1 year) - a converse secondary progressed chart, used in pre-natal astrology,
· Tertiary Progressed (1 day = 1 month),
· Minor Progressed (1 month = 1 year),
· Naibod Directed (59°0' = 1 year),
· Primary Directed
To expand or reduce this list you can use the Dual Chart Editor. Invoke a popup menu of Chart Type Selector and select the "Chart Editor" item:
See the following for more information about chart types: Prognostic Charts, Synastry, Horary, Complex Charts.
To create the multibot chart, use
 "Add data set" button (left of "Execute" button).
After that you can input event data for the second (outer) chart of the pair (i.e. the Background data).
To input the background data-set, use the buttons  "Core Data form", "Background Data form" to
switch the Event Data window betweeen the core and background data entry modes.
The window titlebar indicates which form is currently displayed.
"Core Data form", "Background Data form" to
switch the Event Data window betweeen the core and background data entry modes.
The window titlebar indicates which form is currently displayed.
Erecting the chart
After entering the above data, click the Execute button to create the chart.
If the name field in the Core data is not empty and saving mode is established
in the History settings, the newly created chart is
entered into a historical log of calculations, from which it can be quickly recast.
Any case you can save the chart to History by pressing Alt+S keys.
Click the  "History" button
on the Toolbar to open the History log window.
"History" button
on the Toolbar to open the History log window.
The chart is ready. To close the Event Data window, click its Close button.
Data entry assistance
The buttons adjacent the data entryfields assist in speeding up data input into the Event Data window in some situations:
 "Now" button inserts the current
(system) date and time into these two fields of the form,
"Now" button inserts the current
(system) date and time into these two fields of the form,
 "Here" button inserts your present
location (see Your Location)
into the form.
"Here" button inserts your present
location (see Your Location)
into the form.
 "Here and Now" button combines the
functions of the "Now" and "Here" buttons. Also the chart calculted and the Event window closed.
"Here and Now" button combines the
functions of the "Now" and "Here" buttons. Also the chart calculted and the Event window closed.
 "Get from Reference date" button
obtains a date and time for the background data from the Reference Date window.
This feature is available for some types of prognostic chart only.
"Get from Reference date" button
obtains a date and time for the background data from the Reference Date window.
This feature is available for some types of prognostic chart only.
Other functions
The buttons at the top of the dialog window have the following functions:
"Copy" (leftmost top)
copies the data currently on the form to the Windows clipboard (buffer). The data can be pasted,
for example, into a text editor or an e-mail program, etc where it appears as
semicolon-delimited plain text.
 "Paste"
inserts the contents of the Windows clipboard (buffer), if it has a compatible format,
into the currently displayed (core or background data) form. Compatible data is created by
ZET in other parts of the program, e.g. the Search for Event window, aspects'
Dynamics Diagrams.
"Paste"
inserts the contents of the Windows clipboard (buffer), if it has a compatible format,
into the currently displayed (core or background data) form. Compatible data is created by
ZET in other parts of the program, e.g. the Search for Event window, aspects'
Dynamics Diagrams.
 "Reset form" button reinitialises the
displayed form.
"Reset form" button reinitialises the
displayed form.
 "Save to Database '[name]'" saves the data
on the currently displayed form to the currently selected database page, named in the button's
tooltip info.
"Save to Database '[name]'" saves the data
on the currently displayed form to the currently selected database page, named in the button's
tooltip info.
 "Switch Core and Background data"
button exchanges the core and background datasets, i.e. the Core data
is transferred to the Background form, and vice versa.
"Switch Core and Background data"
button exchanges the core and background datasets, i.e. the Core data
is transferred to the Background form, and vice versa.
 "Return" buttons (may be absent from your version of ZET) -
after selecting a Return chart, the drop-down list below allows the selection of
a planet for which a planetary return (i.e. recurrence at a zodiacal longitude) is
to be calculated. The return will be calculated for a date just prior to the date on
the Background data form.
Click the arrow buttons which appear at right when the chart has been cast
to display the next return chart. Repeated clicking on the
arrow buttons generates successive return charts for the planet, forwards or backwards in time.
"Return" buttons (may be absent from your version of ZET) -
after selecting a Return chart, the drop-down list below allows the selection of
a planet for which a planetary return (i.e. recurrence at a zodiacal longitude) is
to be calculated. The return will be calculated for a date just prior to the date on
the Background data form.
Click the arrow buttons which appear at right when the chart has been cast
to display the next return chart. Repeated clicking on the
arrow buttons generates successive return charts for the planet, forwards or backwards in time.
 "Joint mode" button - puts the instance of ZET into a special broadcasting/listening mode
for other instances of ZET, which are also running with Joint mode enabled. In this mode, changes to
the current event data made in one copy of the program are channeled to the other instances, where they
are interpreted as commands to update the event details. This make it possible to synchronize
all instances to update their tableaux, etc.
"Joint mode" button - puts the instance of ZET into a special broadcasting/listening mode
for other instances of ZET, which are also running with Joint mode enabled. In this mode, changes to
the current event data made in one copy of the program are channeled to the other instances, where they
are interpreted as commands to update the event details. This make it possible to synchronize
all instances to update their tableaux, etc.
NOTE: the Cosmos, Sky, Geographical Map, and Constellations tableaux utilize the data on the Core data form (never the Background data).