History of Calculation
A History log facility is available to record the details of charts which have been calculated. The log is incremental, and retains details of previous ZET sessions.
Saving charts to the History log can be done manually or automatically by:
- typing Alt+S from the Chart tableau, or
- selecting the popup menu item "Save current chart" in the History window, or
- checking the option "Automatically save charts in History" in the General Settings window (General tab) - charts are then then recorded automatically when "Execute" is performed in the Event Data window.
Only named charts can be recorded in the History log. If you want the chart to be logged, you must input the name of the native, or caption the event, in the Event Data window.
To open the History of calculations window:
- select the "Horoscope" | "History..." main menu item, or
- click the
 "History" button
on the Toolbar, or
- type the hot-key 'H'.
To erect a chart from the History window:
- double-click a log entry in the left pane, or
- press the "Enter" key when the item is highlighted, or
- select the "Cast Chart" option from the popup menu of the left pane.
The chart is recreated on the Chart tableau using the event data. If specified in the Configuration Manager (available in ZET Geo only), the chart includes the orginal configuration's features: house system, orb table, etc.

The left panel of the window lists the charts in the log, most recently cast charts first. Entries are identified by the chart type (natal, transit, complex, and so on) and the name of the native (caption for the event).
Records may also be marked with a flag  to highlight their importance, etc. This is set by clicking in the flag column of the item
to flag or unflag it.
Flagged records will not be deleted automatically if the log overflows its reserved space
(set on the General Settings, Misc. tab).
Flagged records are promoted to the top of the list if the log is sorted on the flag field.
The right panel contains the details of the currently selected log item:
- Date when the record was logged
- Sequence number of the record
- Name of the configuration with which the chart was created
- The primary core data set (e.g. radix):
- Name
- Date, time, GMT offset
- Name of the location (city)
- Geographical coordinates of the location
- List of chart types comprising this record
- The secondary (background) data set:
- Name or caption of the event
- Date, time, GMT offset
- Name of the location (city)
- Geographical coordinates of the location
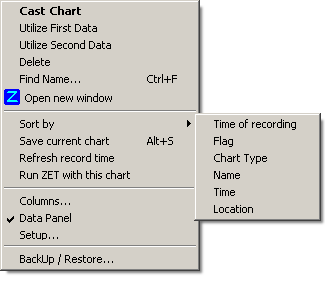
A popup menu is invoked by right-clicking in the left pane of the History window:

- Cast Chart - erects the chart from the selected record. If selection is made using the menu or by double-clicking the item listing with the mouse, then the History log window is closed after the chart has been recreated. If selection is made using the Enter key, the window remains open,
- Utilize First Data - copies the (Core) event data from the record to the fields of the Event Data window without erecting the chart (the Event Data window should be open),
- Utilize Second Data - as above, but for the Background data,
- Delete - displays a confirmation dialog citing the item to be deleted. You may delete several records at once if they are selected together. Deletion can also be performed using the 'Del' key,
- Find Name - displays a find string dialog to find a chart with the specified name at the History log (felpful, if a log is huge),
- Open new window - opens a new ZET instance (runs second ZET application)
with selected chart,
- Sort by [column]... - sorts the log using as a key the column in which the mouse pointer was positioned when the menu was invoked. Sorting can also be performed by clicking the column header. The sorted column is marked by small black triangle in the table's header. Sorting the marked colomm leads to invers the order of sorting,
- Save current chart - adds a log record for the current chart on the Chart tableau. Insertions can also be performed using the Alt+S key combination,
- Refresh record time - when checked, then while select (cast) the chart from the History log, then time of record is updated by current time (top right of window),
- Run ZET with this chart - if checked by
 ,
then this chart will be casted (erected) automatically, when ZET starts next time,
- Columns... - invokes the Columns Wizard to select a set of History log columns to disply,
- Data Panel - if checked, then allows to disply the left panel of History log to disply additional data of the selected record,
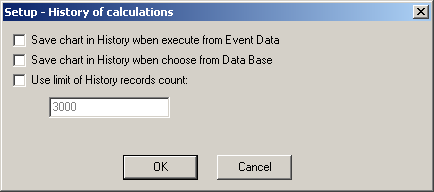
- Setup... - invokes the setup window with additional options:

- There are options to automatically save charts in the Hisrory log and to set
the limit of records count (size of log).
If the limit option is not checked, then the number of records is not limited.
Should the log overflow, the last (oldest) record is deleted to accommodate the next insertion.
Flagged records are not deleted.
- Backup / Restore... - invokes the Backup Wizard window, intended εω backup your data for possibility to restore it in case of loss or desrtroy these data.
The History log is stored in the History.log file in the ZET folder.
Backup this file time to time to safe your data in case of computer damage.