Aspect Dynamics
Dynamic Diagrams are a precision display of an aspect's development in time.
An aspect's Dynamics Diagram window is opened by:
- right-clicking a planet glyph on the chart wheel to display its popup menu, and selecting an aspect listed on its menu,
- placing the mouse pointer on an aspect line in the center of the chart wheel, and clicking when the aspects's info tooltip appears (for declination aspects, near the midpoint of the arc),
- selecting the "Dynamics Diagram" item from popup menus, e.g. in the Aspects Grid, the Aspects Diagram, etc.
Multiple Dynamics Diagram windows can be opened if this option is selected on the Chart Settings - Data tab.
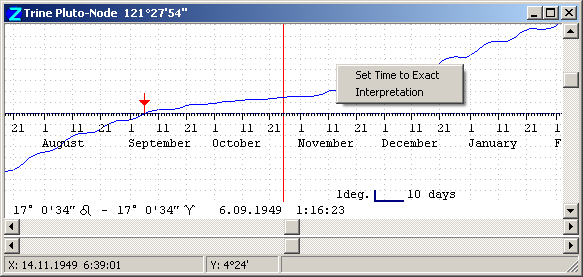
The window depicts a diagram (graph) of the separation of the aspecting bodies relative to perfection, charted against time. Its significant features are:
- The title bar names the aspect, the aspecting bodies, and their current distance apart,
- The vertical red line marks the current (event data) date and time,
- The blue line shows how the separation of the bodies changes over time: when it approaches the time line, the bodies are applying; when it recedes from the time line, the bodies are separating,
- The aspect reaches perfection (i.e. exactness) when the blue line crosses the central axis - this moment is highlighted by the red arrowed marker,
- The time of perfection, and the positions of the planets at this moment, are shown at the bottom of the window,
- When the mouse pointer is moved over the window, the Status bar at the bottom of the window shows the date and time at the pointer (X: readout), and the distance from perfection (Y: readout).
In the example shown, we quickly see that the trine between Pluto and the Node was exact about 7 weeks ago, when Pluto was at 17°0'34" Leo and the Node at the same degree of Aries. We also see that that the planets are separating at present, having receded to about 1.5 degrees apart. How will the aspect develop further? Let's see...
- The lower horizontal scrollbar shifts the time window left and right, i.e. backwards and forwards in time,
- The upper horizontal scrollbar zooms in and out in the time domain,
- The vertical scrollbar magnifies the 'field of view', i.e. it zooms in and out on the aspect.
You can adjust the window to any desired size using the standard window decorations.
You can use the sliders on the Dynamics of Time panel to 'scrub' the current time marker.
Menu options
Right-click in the window for a popup menu, as shown:
- Set Time to Exact - makes the time and date of perfection the current event-data time, and updates the Chart tableau and other open window to this time,
- Interpretation - displays an astrological interpretation of the aspect.
The aspect details line at the bottom of the window has its own popup menu:
- Copy Date and Time - copies the time and date of perfection to the clipboard, e.g. for pasting into the Dynamics of Time control panel, the Event Data window, etc.
Typing Ctrl+C copies the window graphic to the Windows Clipboard as an image.
All open Dynamics Diagram windows redraw when the current event data time changes, e.g. under animation.